Vaccine disparities emerge
Published 7:36 pm Wednesday, February 17, 2021
|
Getting your Trinity Audio player ready...
|
By Stephen Faleski and Jimmy LaRoue
Staff Writers
Is the Western Tidewater Health District getting left behind in the race to vaccinate its residents?
While data from the Virginia Department of Health appears to make that case, officials say the issue is more complex.
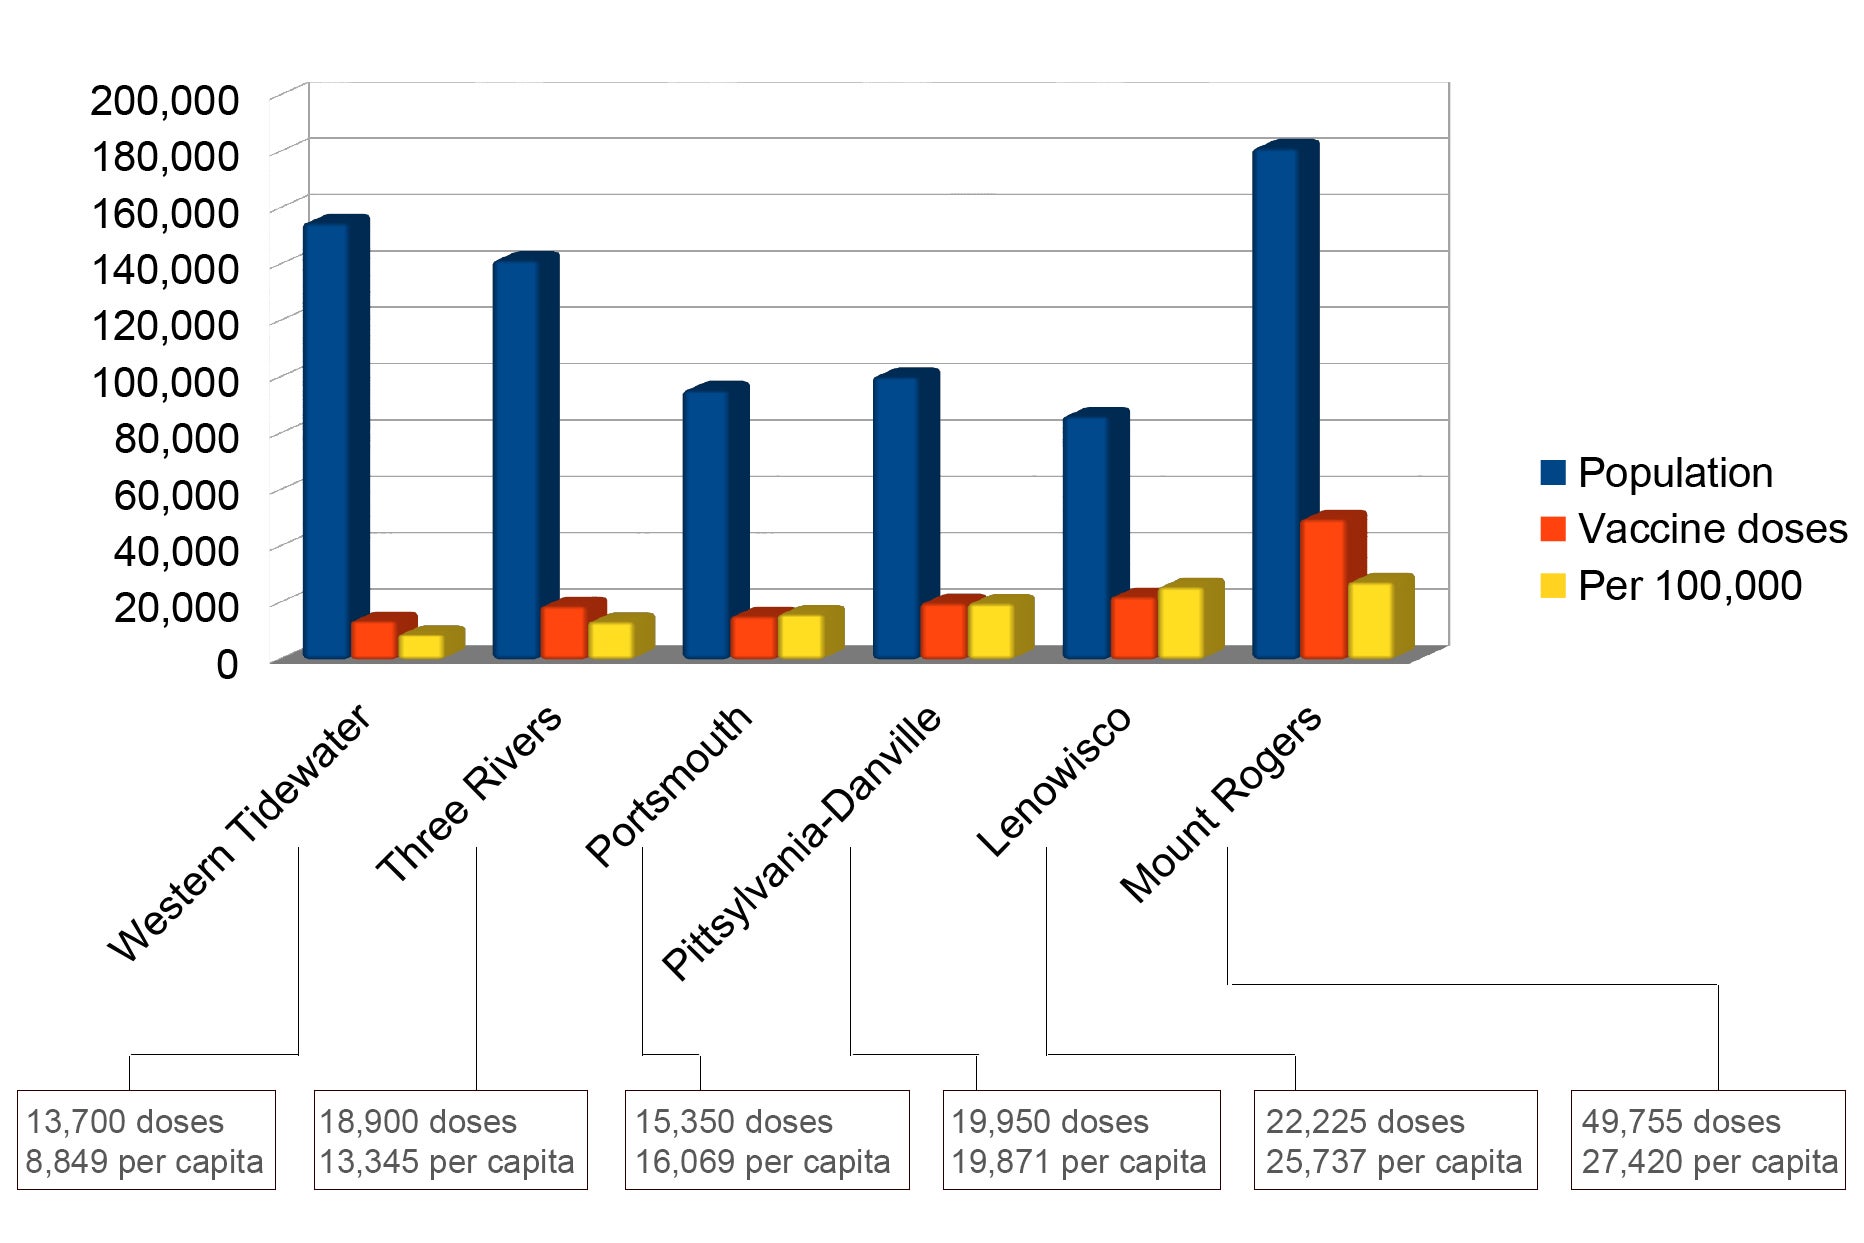
As of Feb. 15, the Lenowisco Health District, which encompasses three counties and one city near Virginia’s border with Kentucky and Tennessee, had received 22,225 COVID-19 vaccine doses according to the Virginia Department of Health’s online dashboard — and has fully vaccinated just over 4%, or 3,622 of its 86,353 residents, per U.S. Census Bureau estimates from 2019.
The Western Tidewater Health District, by comparison, had received only 13,700 doses by the same date for its estimated 154,000-plus residents across Isle of Wight County, Southampton County and the cities of Suffolk and Franklin. It had vaccinated just over 2%, or 3,488, of its residents.
At the end of January, Virginia had received 300,000 requests for the 105,000-dose supply available at the time, prompting the state to shift its distribution strategy from a logistical one — the faster you can get shots into arms, the more you receive — to one based on a health district’s population. But Lenowisco’s seemingly disproportionate allocation versus Western Tidewater’s isn’t the only disparity that’s emerged in the weeks following.
At least three additional health districts, all with 10,000-plus fewer residents than Western Tidewater, have each received several thousand more doses. The Three Rivers Health District, which spans 10 counties from Westmoreland to Gloucester, has a district-wide population of roughly 141,626 but had received 18,900 doses as of Feb. 15 — 57% of which were shipped on or after Jan. 24 when the distribution system became population-based.
Portsmouth, a city of roughly 95,000 with its own health district, received 15,350 and the Pittsylvania-Danville Health District, with its population of just over 100,000, had received 19,950 doses.
The Mount Rogers Health District, which spans six counties and two cities, also in the southwest region, has an estimated population of 181,445, just 17% higher than Western Tidewater, but has received 49,775 vaccine doses to date — more than three times Western Tidewater’s allocation. However, just over 70% of Mount Rogers’ vaccine supply was shipped prior to the allocation system becoming population-based.
According to Western Tidewater Health District Emergency Manager Will Drewery, the district had been slated to receive 10,000 to 11,000 doses intended for distribution among local health departments, private medical practices, hospitals and pharmacies in its four localities prior to the state-level shift in strategy — but received only 900 district-wide the week of Jan. 25-29.
In Franklin, the smallest of the four Western Tidewater localities with a majority-Black population of roughly 8,000, City Manager Amanda Jarratt called the shift to a population-based strategy “devastating,” speculating on Jan. 25 that if the city’s and Western Tidewater’s share of vaccines continued as-is, it would take over a year to vaccinate Franklin’s entire population. As of Feb. 15, the city’s 23 cumulative COVID-19 deaths equated to roughly 288.7 per 100,000, making the city Virginia’s fourth worst for deaths per capita, with Southampton County in fifth place, according to an analysis of VDH data by the nonprofit Virginia Public Access Project.
According to a separate VDH dashboard that shows the number of shots going into arms locality by locality, the city’s vaccine outlook has since improved, with nearly a quarter of its residents — or roughly 21,878 per 100,000 — having received at least the first of the two required doses.
That’s roughly double the rate per capita of Suffolk, whose estimated 92,000 residents comprise the bulk of Western Tidewater’s population. As of Feb. 15, Suffolk had injected 10,869 doses into arms — enough to give roughly one in eight residents a first dose or fully vaccinate one in 16. But only 2,037, or roughly one in every 45, had received their second dose by that same date.
According to Melissa Gordon, a spokeswoman for the VDH, the doses reported on the allocation-by-health-district dashboard don’t include the 178,425 that as of Feb. 11 had been received through the federal long-term care program for nursing homes and assisted living facilities. While it does count the number of doses shipped directly to a facility, based on where in the state that facility is located, “it does not take into account if any of those vaccine doses are redistributed to other facilities,” Gordon said. “In some cases, a bulk shipment to a large hospital will then be redistributed to other vaccine administration sites in that health system, or even outside that health system, to community clinics. VDH continues to work to better understand the redistribution of doses to other vaccine administration sites.”
Over this past weekend, the state took the allocation-by-health-district dashboard offline, but the data remains downloadable in Microsoft Excel format.
According to Dr. Danny Avula, Virginia’s state-level vaccine coordinator, a health district’s population is indeed the primary factor — but not the only one — in determining the allocation of the state’s vaccine supply.
“I think the allocation formula is going to likely evolve week-in, week-out,” Avula said during a Feb. 12 teleconference call. “There are, I would say, four primary considerations, maybe five, but even that will evolve.”
Population, he said, is still the “primary lens” for allocation, “but then we need to look at things like the weighting of the 65-and-older populations.”
“Some parts of our state can have many older residents, and again, because we know there are risks, we will get to a point where we’re going to have to make decisions between — do you send vaccines to a place with a bunch of younger population or do we weight the allocation for folks with more seniors?” Avula said.
A health district’s percentage of Black and Latino residents, whose populations have seen more severe COVID-19 outcomes, is another factor, “not necessarily by formula but more by opportunity,” Avula said. “As providers and health departments and health systems partner with the NAACP and congregations and other networks in their community to really get at those harder-to-reach populations, we are prioritizing vaccine for those types of efforts.”
Hospitalization and death rates are the third factor.
Factor No. 4, Avula explained, is the number of essential workers living in a particular area.
“There are places in our state, such as Northern Virginia and Richmond are ones that immediately come to mind … there’s going to be an undue burden on some communities to vaccinate more essential workers, so we’ve got to look at that data and figure out how much that’s impacting vaccination demand in different communities and use that to drive allocation as well. So, it’s a work in progress.”
“What I’d like to try to do is get that into more of a formula, but really, so much of it depends on weekly supply,” Avula added. “That will kind of morph from week to week, but I think as long as people know, what are the factors that we’re taking into consideration and how heavily are we weighting them, my hope is that local governments will have a sense of how this is playing out.”
More COVID-19
SportsPlus
How to Watch the WNBA Today | September 1
In one of five compelling matchups on the WNBA slate today, the Seattle Storm and Connecticut Sun will…
WNBA Betting Picks: Sunday, September 1
Wondering how you should bet on today’s WNBA games? Look no further. Below you’ll find computer predictions on…
Orioles vs. Rockies: Betting Preview for August 31
On Saturday, August 31 at 8:10 p.m. ET, the Baltimore Orioles (78-58) visit the Colorado Rockies (50-86) at…
How to Watch the Orioles vs. Rockies Game: Streaming & TV Channel Info for August 31
Brenton Doyle and the Colorado Rockies hit the field on Saturday at Coors Field against Dean Kremer, who…
How to Watch MLB Baseball on Saturday, August 31: TV Channel, Live Streaming, Start Times
Today’s MLB schedule has plenty of quality competition in store. Among those contests is the Los Angeles Dodgers…